
Guiding Multi-Objective Genetic Programming with Description Length Improves Symbolic Regression Solutions
Published in Submitted, 2026
Recommended citation: G. Kronberger, F. Olivetti de Franca, D.J. Bartlett, H. Desmond, P.G. Ferreira (2026). "Guiding Multi-Objective Genetic Programming with Description Length Improves Symbolic Regression Solutions." arXiv:2605.22374.
Abstract
Symbolic regression with genetic programming (GPSR) may suffer from overfitting and structural bloat, especially when noise is present. In this paper we evaluate description length (DL) and fractional Bayes factor (FBF) criteria as principled, data-efficient alternatives to heuristics for selecting compact expressions that generalise well. We implement DL using a Fisher-information-based parameter encoding and compare it to AIC and BIC across multiple datasets, including noisy synthetic benchmarks and real-world regression problems. We study three search/selection strategies: (i) multi-objective search for accuracy and program length followed by DL/FBF selection; (ii) multi-objective search using DL directly as an objective; and (iii) single-objective optimisation with DL/FBF as the fitness. Across datasets we find that DL/FBF post-selection improves test performance compared to AIC/BIC baseline and that BIC in combination with the same function complexity penalty from DL/FBF produces similar results. In contrast, using DL/FBF directly as a fitness function in single-objective GPSR frequently induces premature convergence to overly simple models. We conclude with practical guidance for using DL/FBF as robust model-selection tools in genetic programming workflows.
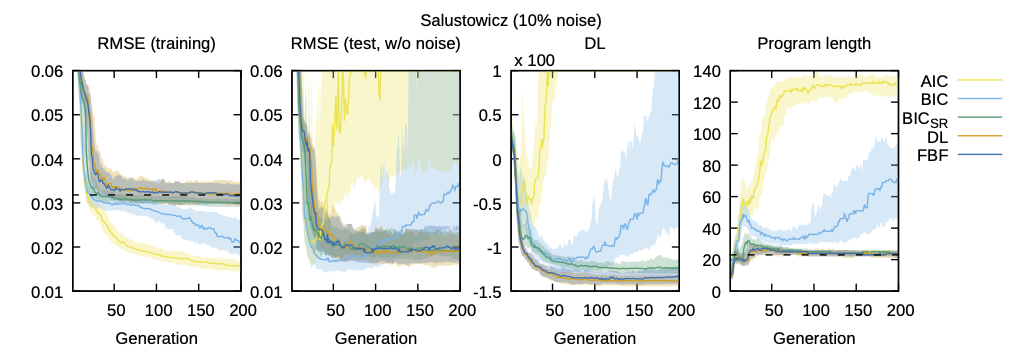 Comparison of selected model metrics for MO-Length on the Salustowicz dataset. The panels show RMSE on the training and test sets, description length, and program length for the four model selection criteria. Across 100 MO-Length runs, the different model selection criteria are used to select a single model from the Pareto front in each generation. The lines show the median values, and the shaded areas show the 25\% and 75\% percentiles over generations. The dashed line in the first panel shows $\sigma_\text{err}$, in the last panel the length of the generating expression.