
Constraining dark matter halo profiles with symbolic regression
Published in Philosophical Transactions A (Accepted), 2025
Recommended citation: A. Martín, T. Yasin, D.J. Bartlett, H. Desmond and P.G. Ferreira (2025). "Constraining dark matter halo profiles with symbolic regression." arXiv:2511.23073.
Abstract
Dark matter haloes are typically characterised by radial density profiles with fixed forms motivated by simulations (e.g. NFW). However, simulation predictions depend on uncertain dark matter physics and baryonic modelling. Here, we present a method to constrain halo density profiles directly from observations using Exhaustive Symbolic Regression (ESR), a technique that searches the space of analytic expressions for the function that best balances accuracy and simplicity for a given dataset. We test the approach on mock weak lensing excess surface density (ESD) data of synthetic clusters with NFW profiles. Motivated by real data, we assign each ESD data point a constant fractional uncertainty and vary this uncertainty and the number of clusters to probe how data precision and sample size affect model selection. For fractional errors around 5%, ESR recovers the NFW profile even from samples as small as 20 clusters. At higher uncertainties representative of current surveys, simpler functions are favoured over NFW, though it remains competitive. This preference arises because weak lensing errors are smallest in the outskirts, causing the fits to be dominated by the outer profile. ESR therefore provides a robust, simulation-independent framework both for testing mass models and determining which features of a halo’s density profile are genuinely constrained by the data.
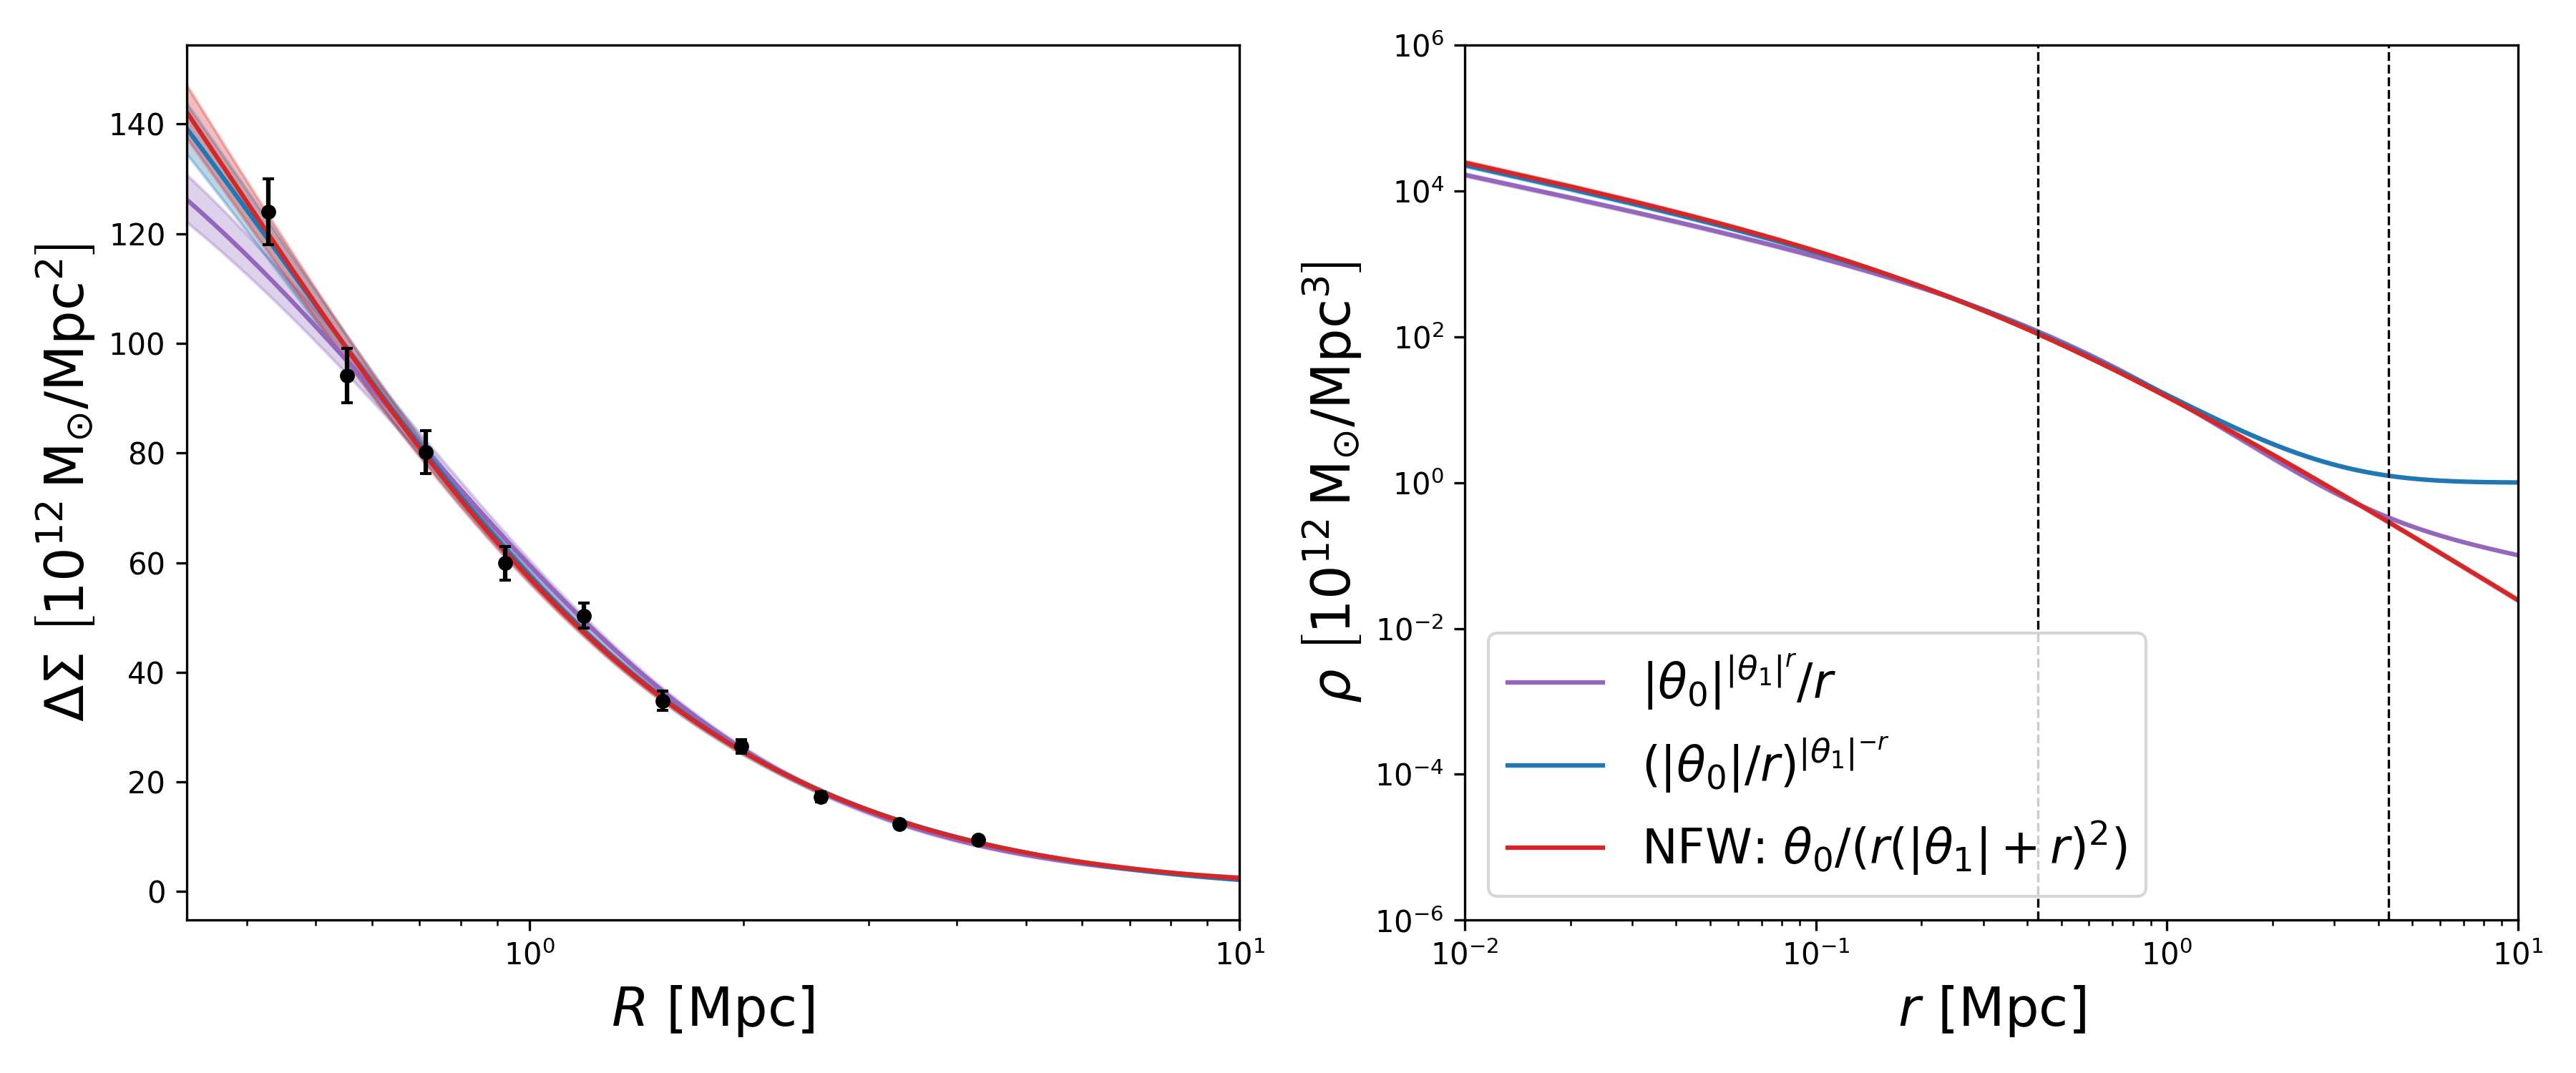 An example result of the ESR fitting procedure for one mock galaxy cluster, generated with a fractional uncertainty of $f = 0.05$. Left panel: The mock weak lensing ESD data (black points) are compared to the best-fit NFW profile (red) and the next two best-fitting functions discovered by ESR, $|\theta_0|^{|\theta_1|^r}/r$ (purple) and $\left(|\theta_0|/r\right)^{|\theta_1|^{-r}}$ (blue). Right panel: The corresponding 3D density profiles ($\rho$) for the three models as a function of the intrinsic 3D radius. The vertical dotted lines mark the radial range of the ESD data from the left panel.