
Constraints on dark matter and astrophysics from tomographic gamma-ray cross-correlations
Published in Physical Review D, 2023
Recommended citation: A. Paopiamsap, D. Alonso, D.J. Bartlett and M. Bilicki (2023). "Constraints on dark matter and astrophysics from tomographic $\gamma$-ray cross-correlations." Phys. Rev. D 109, 103517.
Abstract
We study the cross-correlation between maps of the unresolved $\gamma$-ray background constructed from the 12-year data release of the Fermi Large-Area Telescope, and the overdensity of galaxies in the redshift range $z\lesssim0.4$ as measured by the 2MASS Photometric Redshift survey and the WISE-SuperCOSMOS photometric survey. A signal is detected at the $8-10\sigma$ level, which we interpret in terms of both astrophysical $\gamma$-ray sources, and WIMP dark matter decay and annihilation. The sensitivity achieved allows us to characterise the energy and redshift dependence of the signal, and we show that the latter is incompatible with a pure dark matter origin. We thus use our measurement to place an upper bound on the WIMP decay rate and the annihilation cross-section, finding constraints that are competitive with those found in other analyses. Our analysis is based on the extraction of clean model-independent observables that can then be used to constrain arbitrary astrophysical and particle physics models. In this sense we produce measurements of the $\gamma$-ray emissivity as a function of redshift and rest-frame energy $\epsilon$, and of a quantity $F(\epsilon)$ encapsulating all WIMP parameters relevant for dark matter decay or annihilation. We make these measurements, together with a full account of their statistical uncertainties, publicly available.
Code
The data and code for this article is available here.
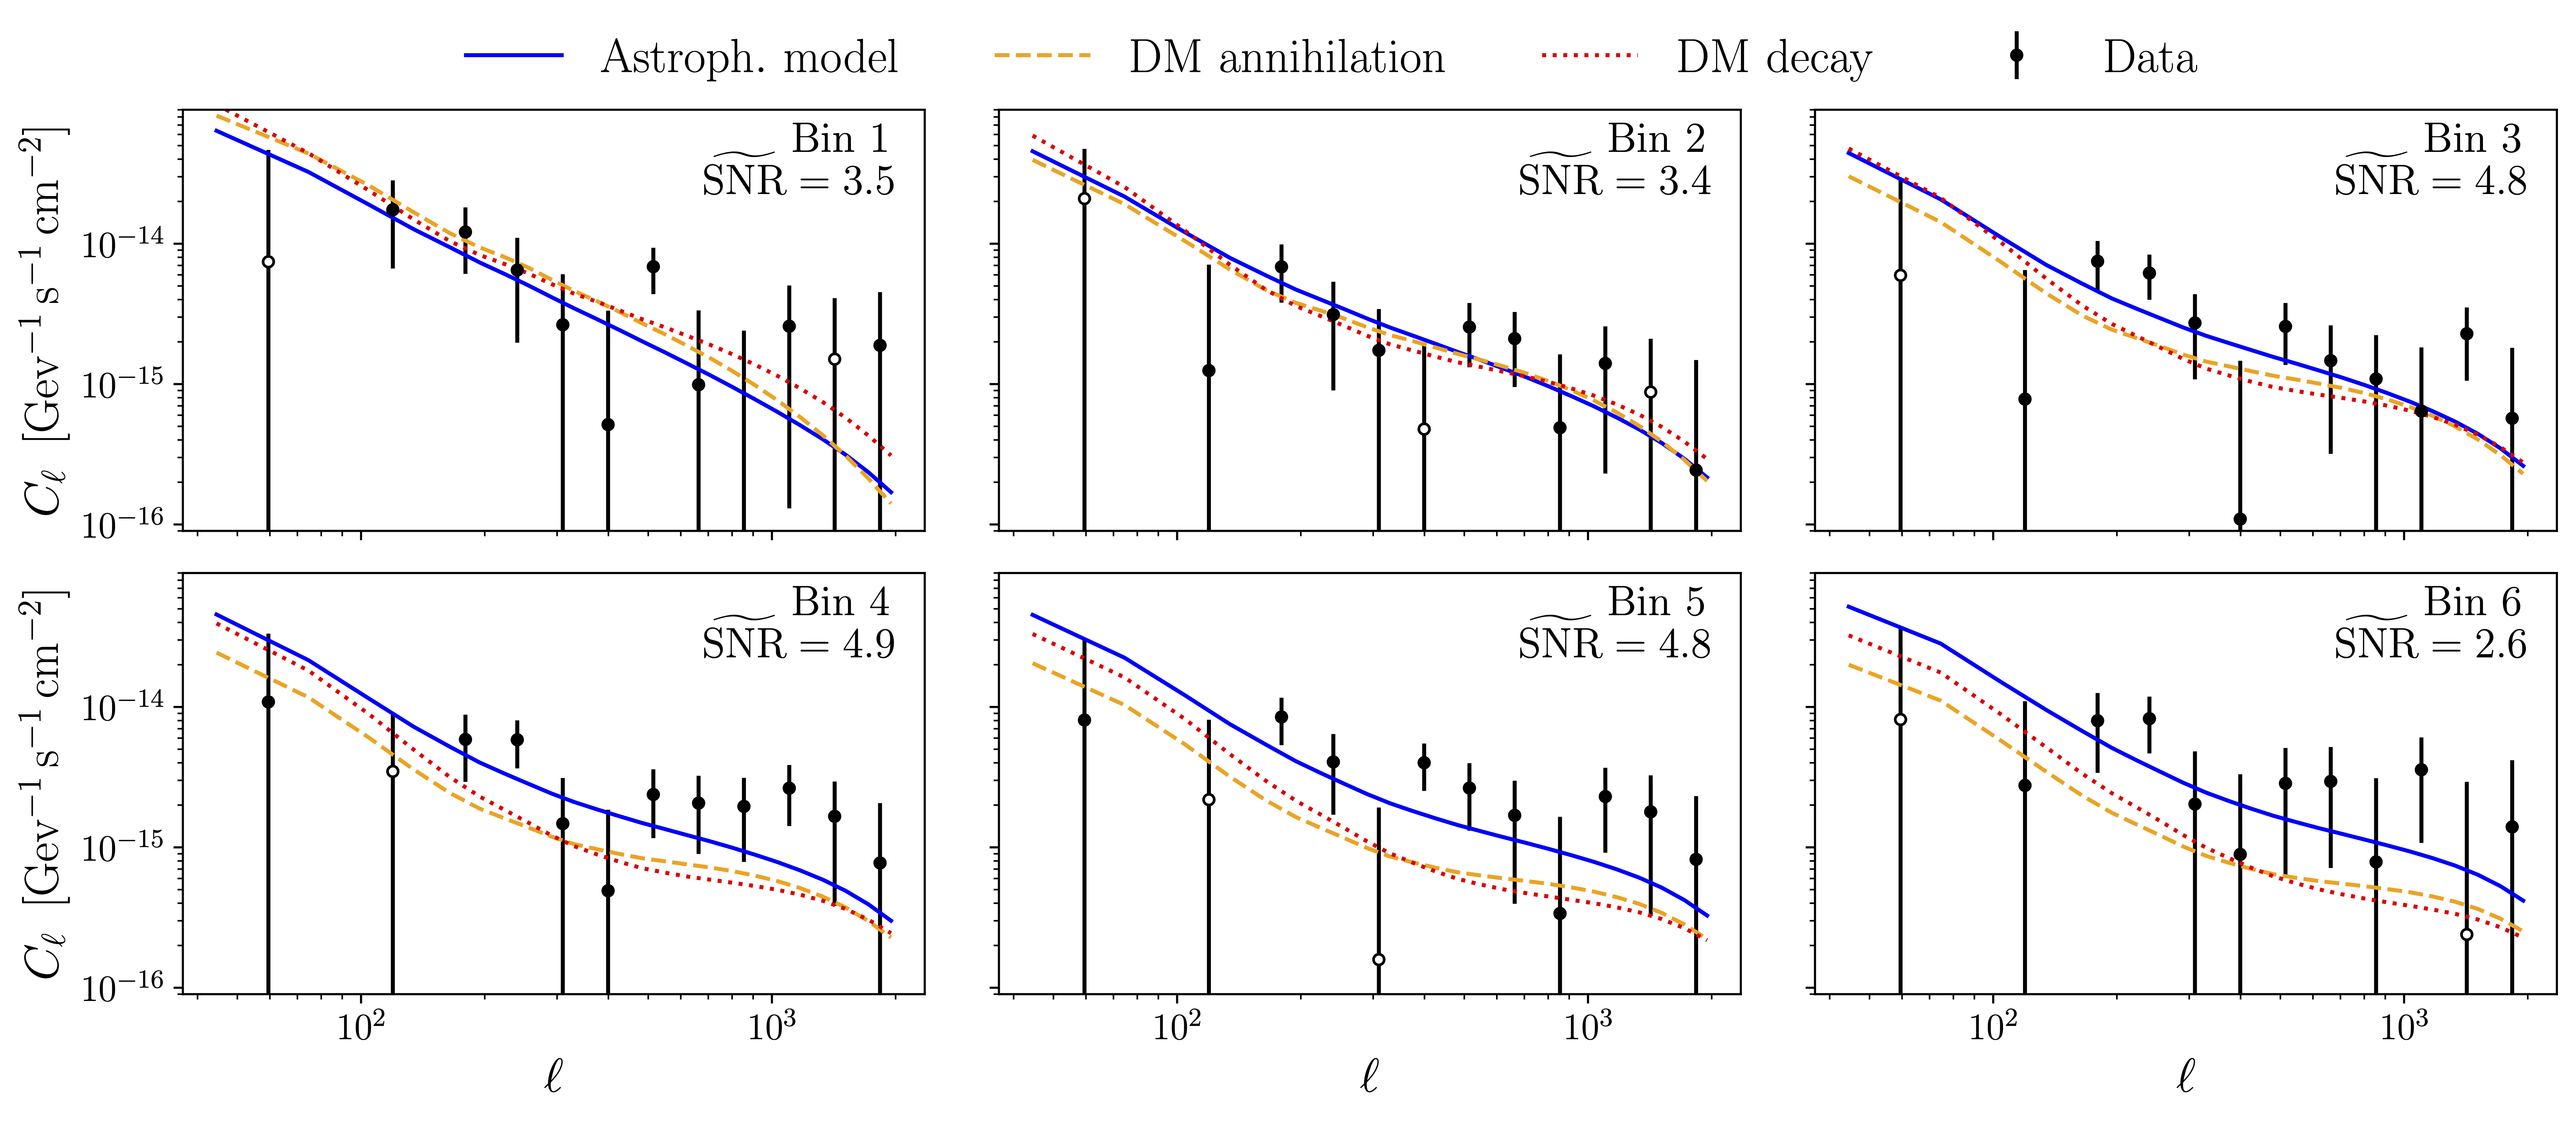 Cross-correlations between Fermi-LAT and the 6 2MPZ and WI-SC galaxy samples. Each panel shows the power spectrum coadded over $\gamma$-ray energies assuming a power-law spectrum with spectral index $\alpha=-2.26$ and inverse-variance weighting. The measured power spectra are shown as black circles with error bars. Empty circles show the absolute value of a given measurement when negative. The solid blue lines show the best-fit predictions for the astrophysical model presented in Section V C, while the dashed orange, and dotted red lines show the best predictions for DM annihilation and decay, respectively, described in Section V B 1 (obtained from the model-independent reconstruction of $F(\epsilon)$, and hence independent of the specific decay/annihilation channel and WIMP mass).