
The scatter in the galaxy–halo connection: a machine learning analysis
Published in MNRAS, 514(3):4026–4045, 2022
Recommended citation: R. Stiskalek, D.J. Bartlett, H. Desmond, and D. Anbajagane (2022). "The scatter in the galaxy–halo connection: a machine learning analysis." MNRAS, 514(3):4026–4045.
Abstract
We apply machine learning, a powerful method for uncovering complex correlations in high-dimensional data, to the galaxy–halo connection of cosmological hydrodynamical simulations. The mapping between galaxy and halo variables is stochastic in the absence of perfect information, but conventional machine learning models are deterministic and hence cannot capture its intrinsic scatter. To overcome this limitation, we design an ensemble of neural networks with a Gaussian loss function that predict probability distributions, allowing us to model statistical uncertainties in the galaxy–halo connection as well as its best-fit trends. We extract a number of galaxy and halo variables from the Horizon-AGN and IllustrisTNG100-1 simulations and quantify the extent to which knowledge of some subset of one enables prediction of the other. This allows us to identify the key features of the galaxy–halo connection and investigate the origin of its scatter in various projections. We find that while halo properties beyond mass account for up to $50$ per cent of the scatter in the halo-to-stellar mass relation, the prediction of stellar half-mass radius or total gas mass is not substantially improved by adding further halo properties. We also use these results to investigate semi-analytic models for galaxy size in the two simulations, finding that assumptions relating galaxy size to halo size or spin are not successful.
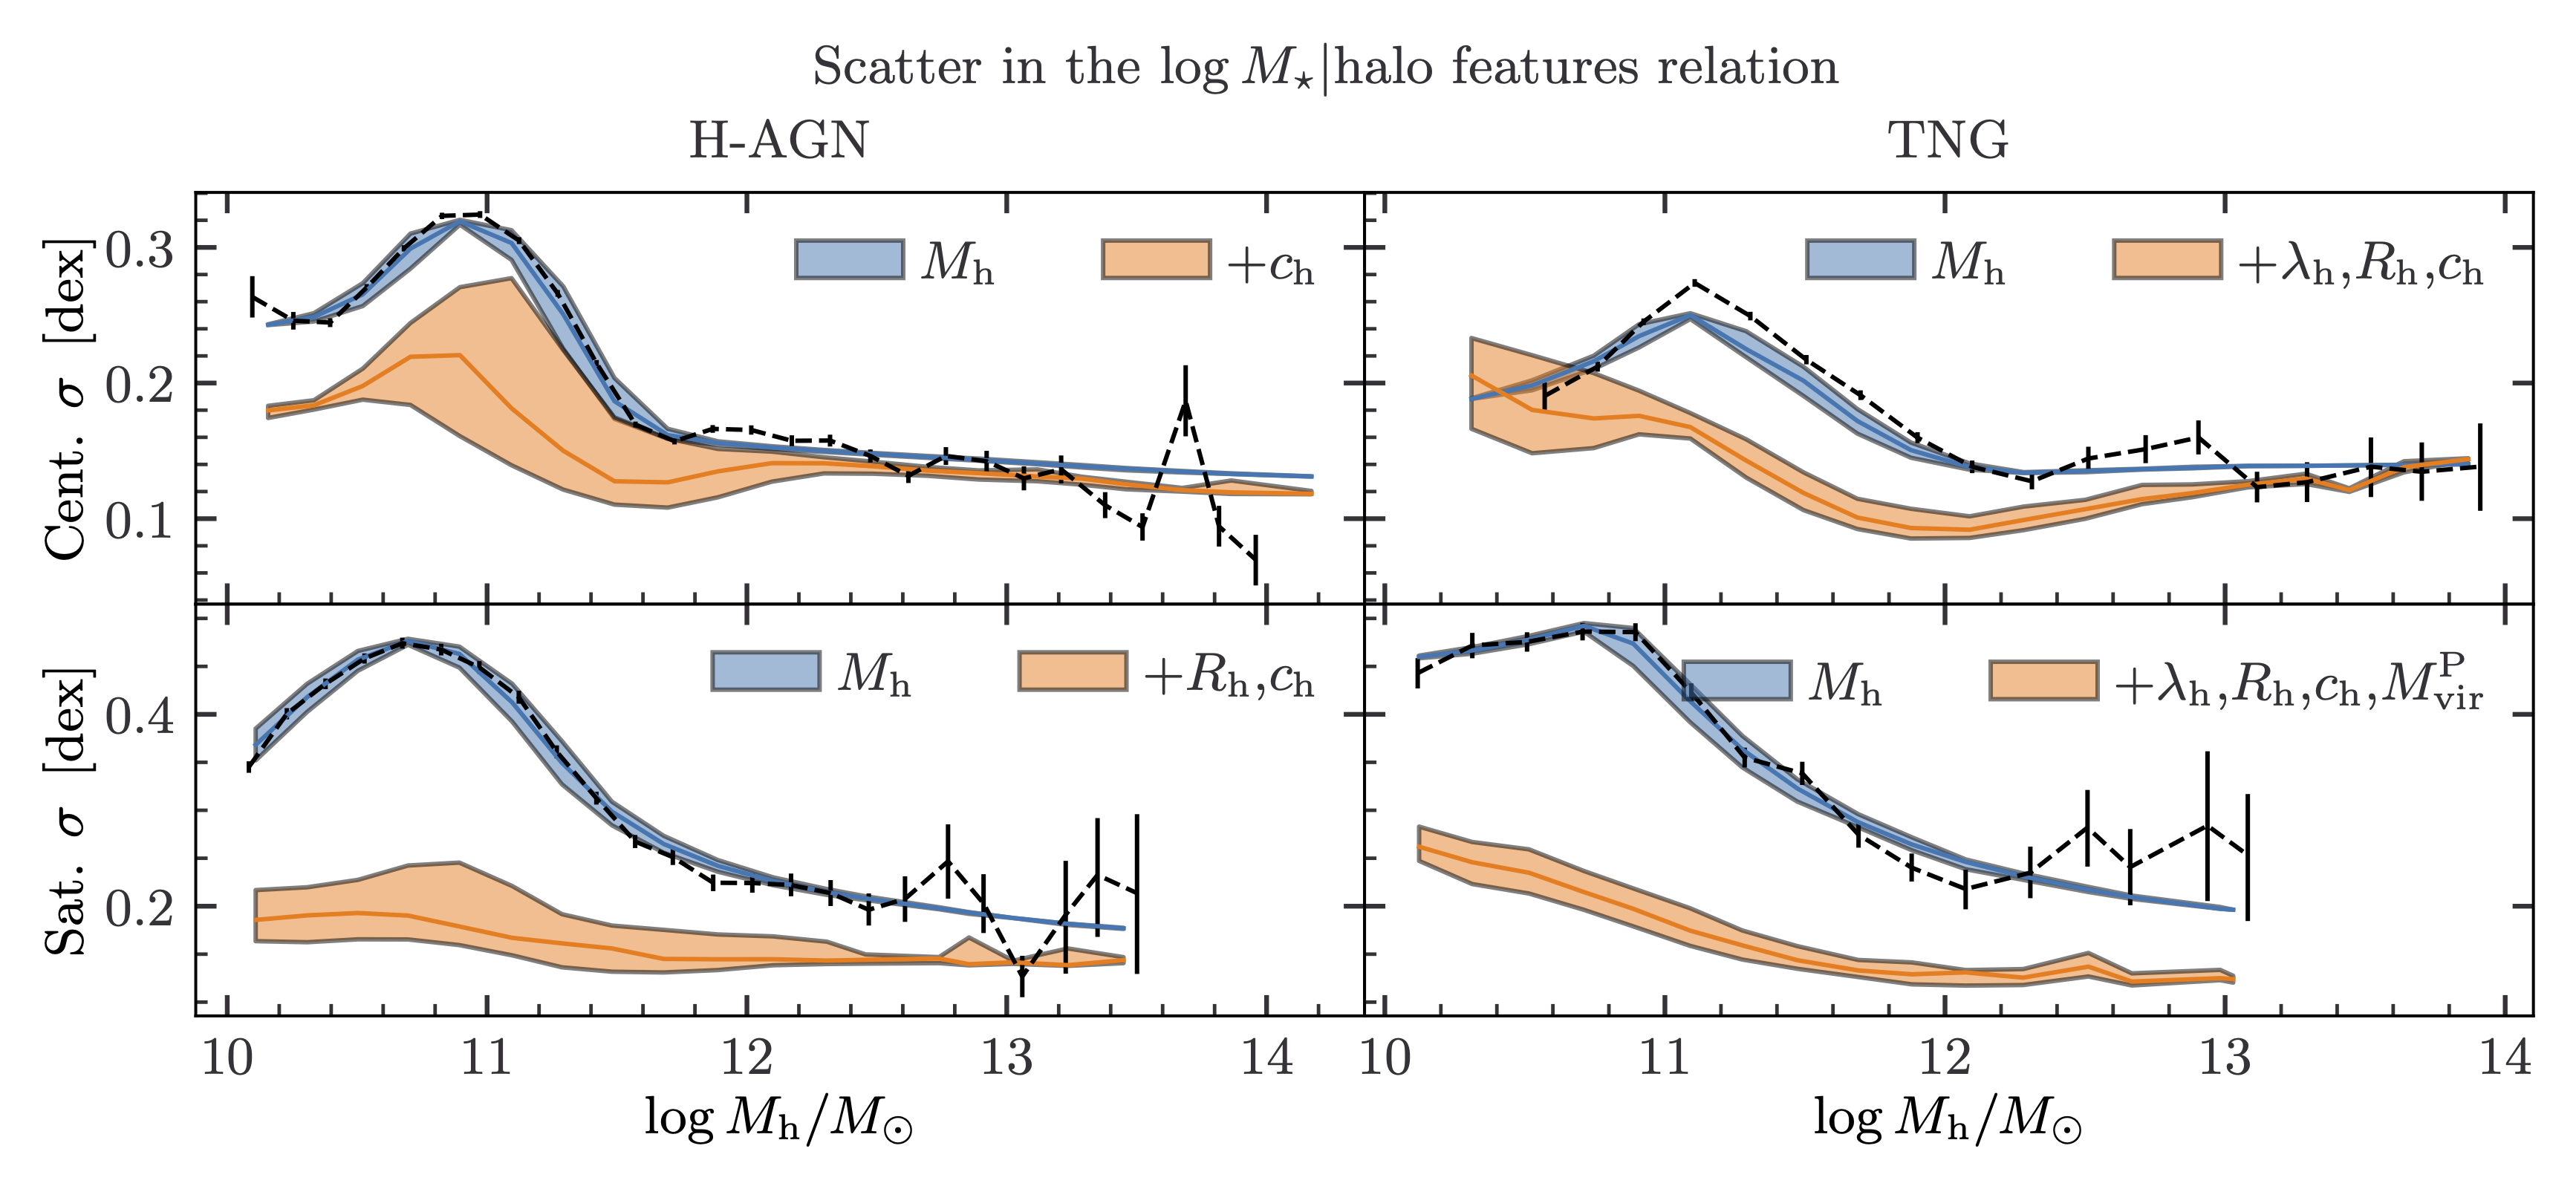 The NNs’ predicted scatter in $\log M_\star$ binned by $\log M_\mathrm{h}$ in H-AGN (left column) and TNG (right column) for central (top row) and satellite (bottom row) galaxies. The legend indicates cumulative halo features used to train the networks, with the bands enclosing the $16^{\rm th}$ to $84^{\rm th}$ percentile of predictions for the scatter for galaxies in a given bin of $\log M_{\rm h}$. The black dashed line is the $\sigma_{\log M_\star | \log M_\mathrm{h}}$ bivariate scatter calculated directly from the simulated points, with a $1$ $\sigma$ error bar obtain by fitting Gaussian distributions within fixed-size $\log M_{\rm h}$ bins as described in Section 3.1. The networks correctly recover the bivariate scatter if trained on $M_{\rm h}$ only (blue band). The orange band includes all other features deemed informative for the prediction of $M_\star$, resulting in a significantly lower uncertainty in $M_\star$ and indicating the extent to which these features correlate with residuals of the $M_\star-M_\mathrm{h}$ relation.